|
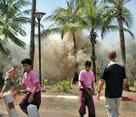
In the wake of the devastating December 26, 2004 tsunamis that
ravaged the coastal communities on the Indian Ocean, research
scientists from the Hazard Reduction and Recovery Center (HRRC)
at Texas A&M University’s College of Architecture traveled
to the hard-hit district of Tamil Nadu, on the southeastern coast
of India, to assess regional response to the disaster and develop
a social vulnerability profile, or map, that could ultimately
assist disaster response initiatives throughout the world.
A social vulnerability map utilizes Geographic Information System
(GIS) technology to merge geographical and government census
data with information gathered through field observation and
surveys, to relate the social characteristics of the target population
with its disaster resilience.
“A lot of what we do here in the college is focused on
the broader perspectives of the built environment,” explained
urban planning professor Walter Gillis Peacock, director of the
HRRC and a member of the tsunami team. “What we do, especially
in planning, is look at the nature of the social systems that
are also operating in those environments and what consequence
that has for making communities more sustainable.”
“It is not simply where you live,” he added, “it
is how many of your characteristics, in terms of access to resources,
education, income, whether you are a renter or a homeowner, whether
you have lots of children or no children at all — all of
those factors contribute to potentially increasing your vulnerability.”
The tsunami, which killed an estimated 6,665 people in the study
area and as many as 229,866 worldwide, presented the HRRC scientists
with an opportunity to validate disaster research theories developed
in the United States, in a completely different political, economic
and social system.
“I don’t think that individual behavior varies a
whole lot from one nation to another,” Peacock said. “It
is the systems that create difference and in India, the economic
system, the population’s social status and governmental
systems are completely different. Those are the things that we
are investigating.”
The assumption, added Carla Prater, an HRRC research scientist
and the principal investigator on the tsunami team, is that the
community characteristics — the local economy, the local
and national government, the availability of non-governmental
relief organizations — combined with the population’s
social profile — education level, family size, income,
religion — have a cumulative affect on the disaster recovery
process and how quickly a specific region might recover.
“We want to create communities that are resilient in the
face of a disaster,” said Prater. “We used to talk
about disaster resistance, but that has connotations that are
not as useful as the concept of resilience, because resilience
implies that yes, you can absorb the impact and you can bounce
back, you can recover.”
By developing a social vulnerability map, disaster officials
and relief organizations can better predict where and what sectors
of a community are going to have a harder time dealing with,
responding to and recovering from a natural disaster.
“Using GIS, we can create the layers of both physical
and social vulnerability and look at the intersections of those
two,” said Prater. “That is what we are interested
in.”
Though the vulnerability mapping initiative benefited tremendously
from the Indian government’s extensive census data, it
was crucial that the research team combine the census information
with data gained in the field, mostly through household surveys.
“We start out with the census data and get as refined
as we can,” explained Prater. “However, we have found
that in relying on the census data alone, you can come up with
some odd things, because the data is collected at a very high
level of aggregation. So we have to go out and check the neighborhoods
to see if there aren’t any anomalies.”
Part of this reconnaissance, or “ground-truthing” effort
involved interviewing government officials and individuals working
for non-governmental organizations (NGOs) involved in the recovery
effort. In turn, many of the NGOs agreed to assist with the actual
field surveys of the tsunami survivors.
“Our original plan was to do some surveying; interviewing
some households in a couple of recovering communities,” said
Peacock. “Because we were able to contact people who work
with NGOs, we are now going to sample 17 different communities
and do random samples, interviewing a total of 1000 households
in those communities.”
“This is an incredible opportunity,” Prater added. “You
have no idea how rare such data are. In social science it is
very difficult and expensive to generate our data because it
involves this really tough and time-consuming expensive research.
So, to get it in a third-world country is practically unheard
of.”
Language was another obstacle the Texas A&M research team
had to overcome. Though English is widely spoken by India’s
educated classes, many of the tsunami victims speak Tamil, the
local language of the state of Tamil Nadu. Not only did they
have to translate their survey into Tamil, they also had to locate
people who spoke that language who were qualified to conduct
the interviews.
The survey establishes the respondents’ household characteristics — what
caste they belong to, how many children they have, its sex and
dependency ratios, overall socio-economic status and religious
characteristics. It also seeks information about the casualties
and deaths suffered from the tsunami, the types of damage endured,
and the impact on the respondents’ physical possessions,
homes and the assets. And finally, it asks what kind of resources
they have received since the disaster, and where the help came
from.
The researchers also learned a lot about working with the Indian
government’s somewhat bloated bureaucracy.
“We would walk into these rooms and there would be 15
or 20 desks with somebody at every desk,” recalled Peacock. “And
by the time we got through, we’d have almost talked to
everybody at everyone of those desks.”
But as a result of their sometimes arduous efforts, the researchers
agreed, they should have enough data to complete a very detailed
statistical analyses that backs up all of the mapping procedures
they have developed. The team postulates the data will demonstrate
that certain types of households were more likely to have suffered
damage than others.
“It is not simply where you live,” said Peacock, “it
is how many of your characteristics — in terms of access
to resources, education, income, whether your are a renter or
a homeowner, whether you have lots of children or no children
at all, all of those factors — contribute to potentially
increasing your vulnerability.
Once complete, the social vulnerability map can be used by state
and local governments for purposes of planning and organizational
structuring in the development of the emergency management organization.
Additionally, vulnerability maps can help NGOs to decide where
they are going to target their community development efforts.
In developing a more disaster resilient community, it will help
them spot an area or population that has not been well served
in the past.
The research team’s findings could also enhance knowledge
about disaster recovery and mitigation efforts back in the United
States.
“It is a big mistake to think that we are going to go
out there and learn something that is only applicable there,” said
Peacock. “Quite often, what we learn is directly applicable
here. The moment you forget that, is the moment that your research
turns into something less than you want, because there are lessons
that can be learned both ways.”
In fact, the whole notion of vulnerability emerged out of research
done in the developing world,” Peacock continued. “We
have been increasingly applying it here in the United States
and have found it to be extraordinarily relevant. Because the
United States is in such a data-rich environment, we have been
able to take these notions and push them much further. So in
some sense, all we are really doing is going back to the source,
where a lot of this vulnerability work was originally done.”
The HRRC researchers, which included Peacock, Prater and graduate
students Himanshu Grover and Sudha Arlikatti, plan to publish
their results in Indian journals.
“We hope that some of these results can be utilized, said
Prater, “and that the Indian researchers can generate this
sort of research for other states.”
|